 Loading Please Wait...Loading Please Wait...
A Journey Optimization Story — DataQuark | Data & AI Insights
Picture your last online purchase. Did you click one banner ad and buy instantly? Probably not. You browsed, got distracted, checked a review, came back, scrolled through recommendations, maybe left and returned a day later.
That's the modern user journey — messy, non-linear, and scattered across devices and channels. And it's exactly why traditional analytics (page views, sessions, bounce rate) fall short. They tell you what happened, but not why users engage, hesitate, or leave.
At DataQuark, we set out to solve this for one of our clients. By combining Google Analytics 4 (GA4) with the raw processing power of BigQuery, we built a full-funnel Journey Optimization framework — and within eight weeks, it delivered a 28% lift in overall user engagement.
Here's exactly how we did it.
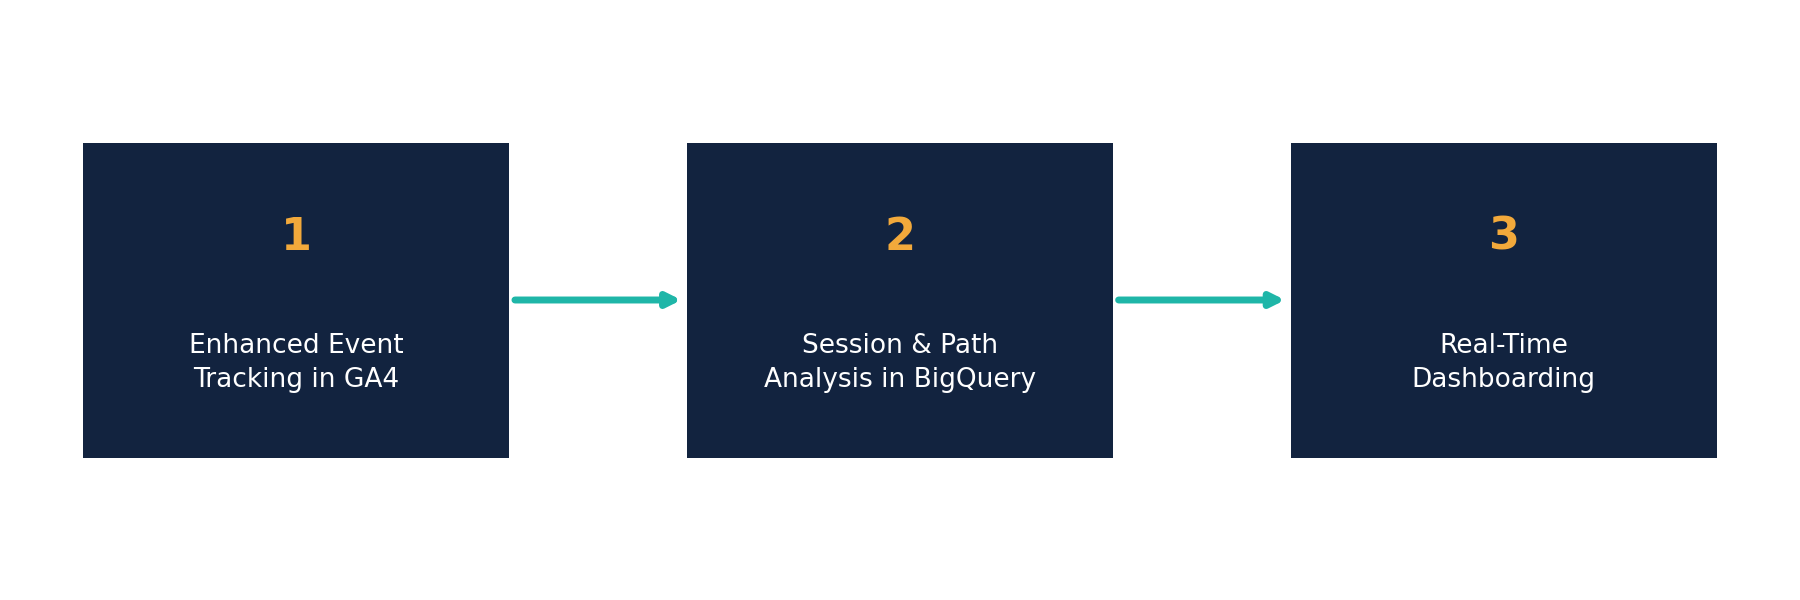
Out of the box, GA4 tracks the basics — pageviews, sessions, clicks. Useful, but shallow. To understand engagement quality, we needed to see the micro-moments that reveal how users actually consume content.
So we layered in custom event tracking for:
This gave us a far richer picture: not just that someone visited a page, but where they paused, what they skipped, and what kept them coming back.
GA4's built-in reports are great for a quick glance, but they can't handle deep, cross-session pattern analysis at scale. That's where BigQuery came in.
We exported raw GA4 event streams into BigQuery and ran advanced analysis to uncover:
Using SQL-based clustering, we grouped users into three distinct journey personas:
Behavior: High navigation but low conversions
Opportunity: Improve content guidance
Behavior: High scroll depth & time
Opportunity: Add stronger CTAs
Behavior: Fast exits
Opportunity: Optimize UI & load times
This one framework changed everything. Instead of designing “for the average user” — who doesn't really exist — we could now design for each behavior type, redesigning navigation flows and content placement with real precision.
Insight is worthless if it sits in a report nobody reads until next quarter. So we built a real-time Looker Studio dashboard powered directly by our BigQuery models, giving teams a living view of:
This turned content, product, and SEO teams from separate departments reacting to monthly reports into one collaborative unit making weekly, data-backed decisions.
Armed with these insights, the team made targeted changes:
The impact, measured over eight weeks:
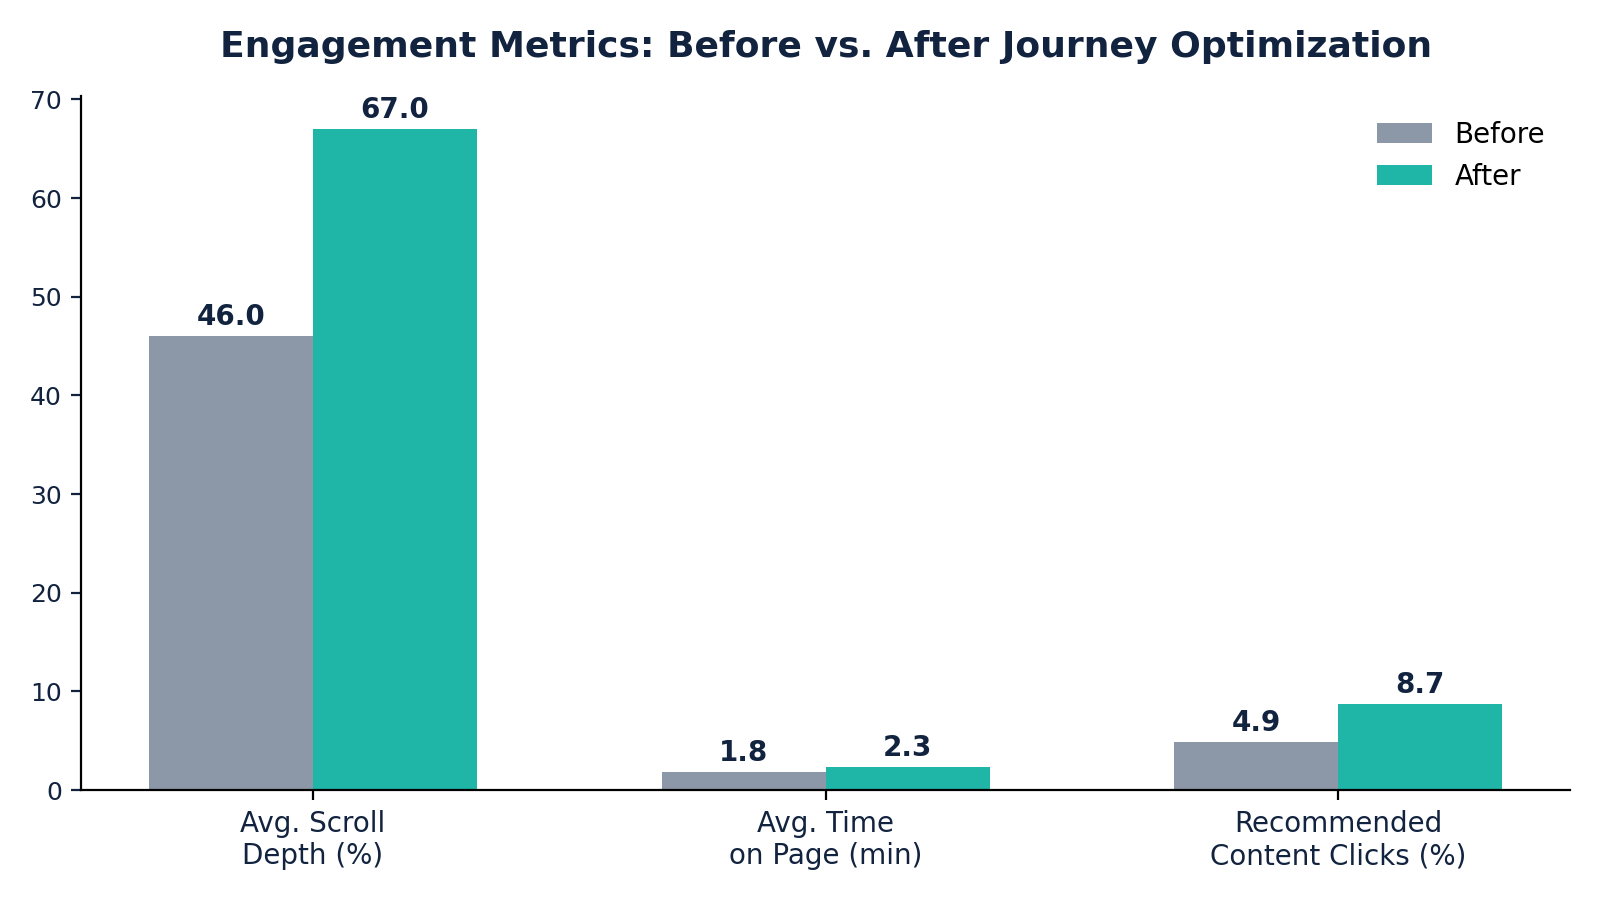
A 28% increase in overall user engagement.
GA4 alone tells you what happened. GA4 + BigQuery tells you why — and lets you act on it in real time.
In a digital landscape where attention is the scarcest resource, brands that merely report on user behavior are already behind. The ones that win are orchestrating journeys — continuously, precisely, and based on evidence rather than guesswork.
That's the shift DataQuark helps brands make: from analytics as a rearview mirror to analytics as a growth engine.
Talk to DataQuark about Journey Optimization with GA4 + BigQuery — from custom events to real-time action dashboards.
Talk to usWhat would you love to learn how to do?