 Loading Please Wait...Loading Please Wait...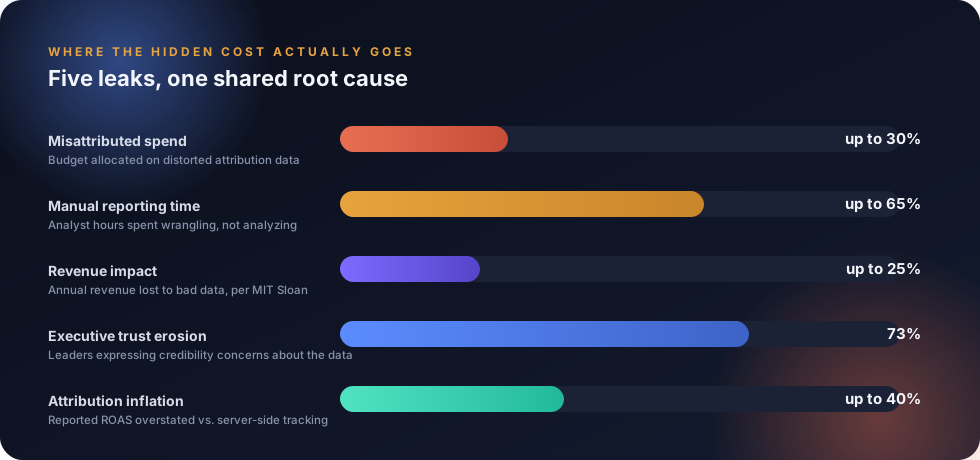
Most companies can tell you exactly what they spend on marketing tools. Ask them what it’s costing them to run those tools without a proper data strategy behind them, and you’ll get a shrug.
That’s the problem with this particular cost. It never shows up as a line item. Nobody’s finance team has a row labeled “money lost to bad data.” It gets absorbed into a dozen other numbers — lower ROAS, longer sales cycles, a marketing team that always seems to need “just one more headcount” — until it’s simply accepted as the cost of doing business.
It isn’t. And the research on this is more specific than most people expect.
Gartner’s often-cited research puts the average cost of poor data quality at roughly $12.9 million a year per organization. It’s a striking number, but it’s also a Fortune-500-sized number — most mid-market companies read it, decide it doesn’t apply to them, and move on.
The more useful way to think about this: poor data quality doesn’t cost a fixed dollar amount. It costs a percentage of efficiency. Research from MIT Sloan and data quality researcher Thomas Redman puts that figure at 15–25% of revenue lost annually to bad data, across company sizes. That’s not a Fortune 500 problem. That’s every company’s problem, scaled to their own revenue line.
Once you stop looking for a single cost and start looking for where it leaks, five places show up consistently.
This is the big one. An analysis from Merit Data & Technology found that poor data quality misallocates 21–30% of marketing budgets — not because teams are bad at their jobs, but because the underlying attribution data is fighting itself. Duplicate UTM tags alone can inflate a channel’s reported performance by 20–40%. Separately, Digital Commerce 360 found marketers themselves estimate they waste around 21% of budget on exactly this kind of inefficiency. Two different sources, landing in the same neighborhood, is usually a sign the number is real.
Someone on your team — usually someone senior enough that their time isn’t cheap — is manually reconciling numbers across platforms every week. Industry estimates on this are almost uncomfortable: analysts report spending anywhere from 50–80% of their time on data wrangling rather than analysis. That’s not a productivity problem. That’s a structural one — the equivalent of hiring a strategist and using them as a data-entry clerk three days out of five.
This is the one people underestimate most. A messy data setup doesn’t stay the same size — it grows. Every new tool, every new campaign, every new report built on top of an already-shaky foundation makes the eventual fix more expensive and more disruptive. Fixing this in year one is a project. Fixing it in year three is a migration.
Once numbers stop matching across reports, something quieter happens: leadership stops trusting marketing’s numbers entirely. The same Merit Data & Technology research found 73% of executives expressing real credibility concerns about the data behind marketing decisions. When that happens, marketing loses influence in budget conversations — not because performance is bad, but because nobody’s fully sure the reported performance is real.
This one’s harder to quantify but easy to feel. When it takes three days to produce a report instead of three minutes, decisions get made on last month’s information, not this week’s. In fast-moving categories, that lag alone can be the difference between catching a trend and reading about it after a competitor already has.
A rough version of the math Take a mid-size company spending ₹4 crore (about $500K) a year on paid media, with a lean team managing reporting manually.
None of this requires a data breach, a system outage, or anything dramatic. It just requires doing nothing.
This isn’t about buying more tools — most companies already have more tools than they use well. It’s about making the tools they have agree with each other: clean pipelines, one source of truth, and reporting that reflects what’s actually happening instead of what each platform wants to claim credit for.
The companies that fix this early don’t necessarily spend less. They spend the same budget, more accurately — which, compounded over a few quarters, tends to look a lot like spending less.
If any of these five costs sounded familiar, you’re not looking at a hypothetical. You’re looking at a number your business is already paying, just not seeing written down anywhere.
Interested in seeing what this might be costing you specifically? Reach out to us — at DataQuark, we’ve worked with plenty of teams who knew something in their data wasn’t adding up, but weren’t sure where to even begin.
Talk to usWhat would you love to learn how to do?